import jax
import os
import jax.numpy as jnp
import jaxidem.utils as utils
import jaxidem.idem as idem

import plotly.graph_objects as go

# The plotting helpers live beside the document that uses them rather than in
# the package; jaxidem.plotters was retired. This chunk runs from the project
# root, and "site" cannot be imported as a package (it is a stdlib module
# name), so the directory goes on the path instead.
import sys
sys.path.insert(0, "site")
from examples_plots import *


# The same spatially variant kernel the hands-on examples use (site/examples.qmd):
# a circular flow, approximated in a 3x3 cosine basis by least squares.
grid = utils.create_grid(bounds=jnp.array([[0, 1], [0, 1]]),
                         ngrids=jnp.array([40, 40]))

K_basis_var = {
    'logit decay': utils.unit_basis,
    'log bandwidth': utils.unit_basis,
    'x offset': utils.place_cosine_basis(N=3),
    'y offset': utils.place_cosine_basis(N=3),
}

s = 0.001
decay = 0.99


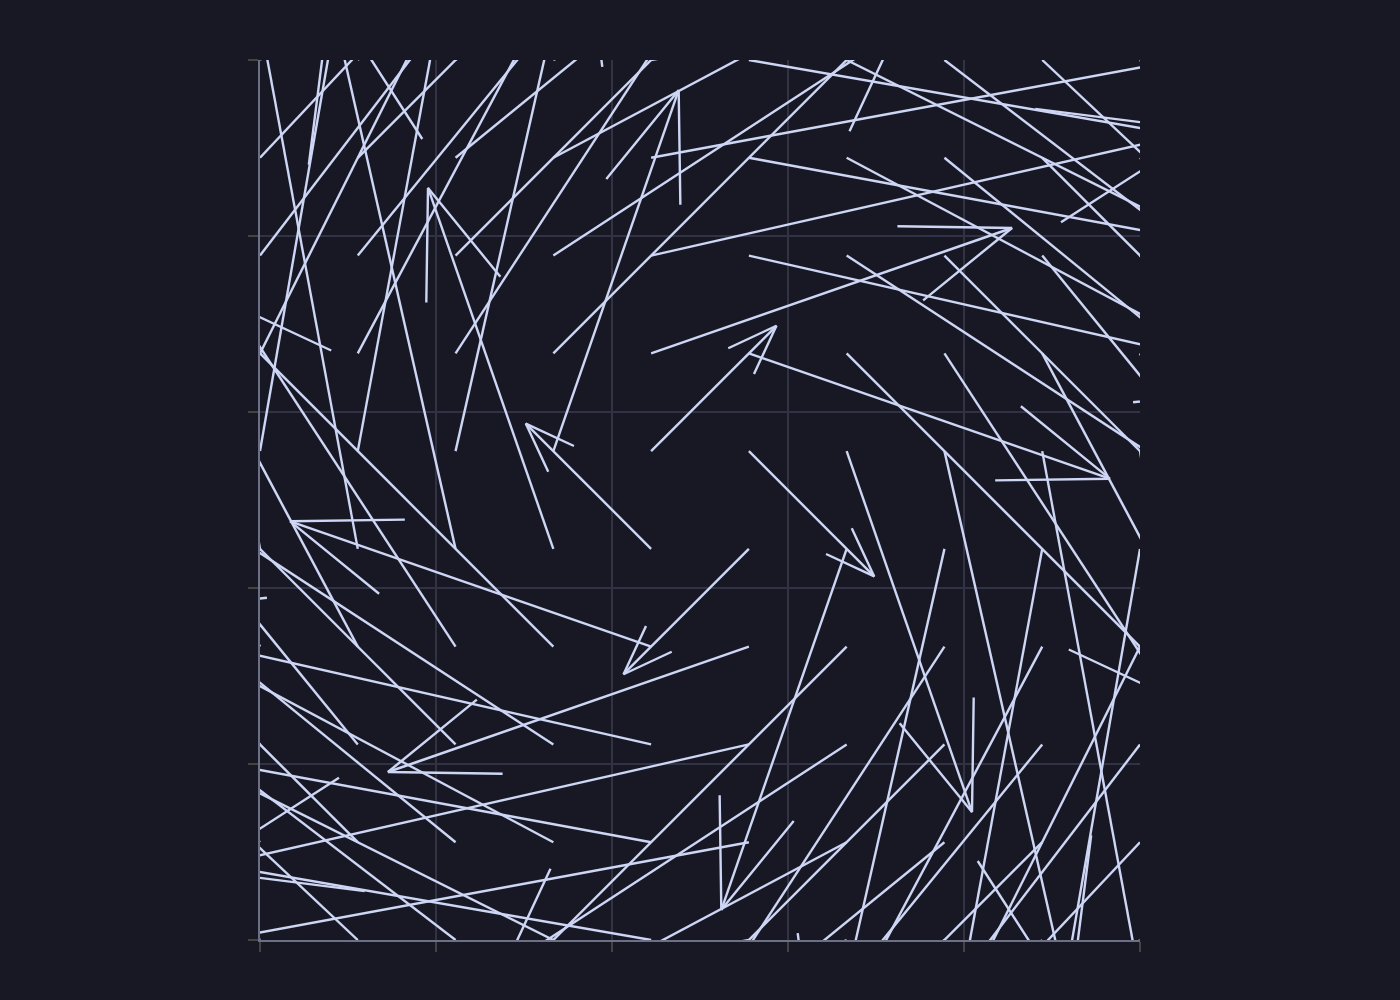
# At any particular point, the vector field is a scaled normal vector to the
# centre [0.5, 0.5], giving the circular advection.
def f(x):
    return 0.4 * jnp.array([-(x[1] - 0.5), (x[0] - 0.5)])


f_on_grid = jax.vmap(f)(grid.coords)

PHI_x = K_basis_var['x offset'].mfun(grid.coords)
PHI_y = K_basis_var['y offset'].mfun(grid.coords)

x_offset = jnp.linalg.pinv(PHI_x) @ f_on_grid[:, 0]
y_offset = jnp.linalg.pinv(PHI_y) @ f_on_grid[:, 1]

k_var = {
    'logit decay': jnp.log(jnp.array([decay / (1 - decay)])),
    'log bandwidth': jnp.log(jnp.array([s])),
    'x offset': x_offset,
    'y offset': y_offset,
}
kernel_var = idem.exp_kernel(K_basis_var, k_var)

keys = jax.random.split(jax.random.PRNGKey(10), 3)
key = keys[0]

process_basis = utils.place_cosine_basis(N=10)

model = idem.gen_example_idem(key,
                              process_basis=process_basis,
                              beta=jnp.array([100.0, -80.0]),
                              covariate_labels=["x", "y"],
                              kernel=kernel_var,
                              S2_eta=2.**2,
                              S2_eps=1.**2)

# Simulation
T = 200
nobs = 100

coords = jax.random.uniform(keys[1], shape=(nobs, 2), minval=0, maxval=1)

times = jnp.repeat(jnp.arange(1, T + 1), coords.shape[0])
rep_coords = jnp.tile(coords, (T, 1))
x = rep_coords[:, 0]
y = rep_coords[:, 1]

# simulate returns the latent coefficients as a third value. Whether the design
# gets an intercept column follows from the model's covariate_labels, which are
# ("x", "y") here, so it does not.
process_data, obs_data, alphas = model.simulate(keys[2], x, y, times,
                                                covariates=jnp.column_stack([x, y]))

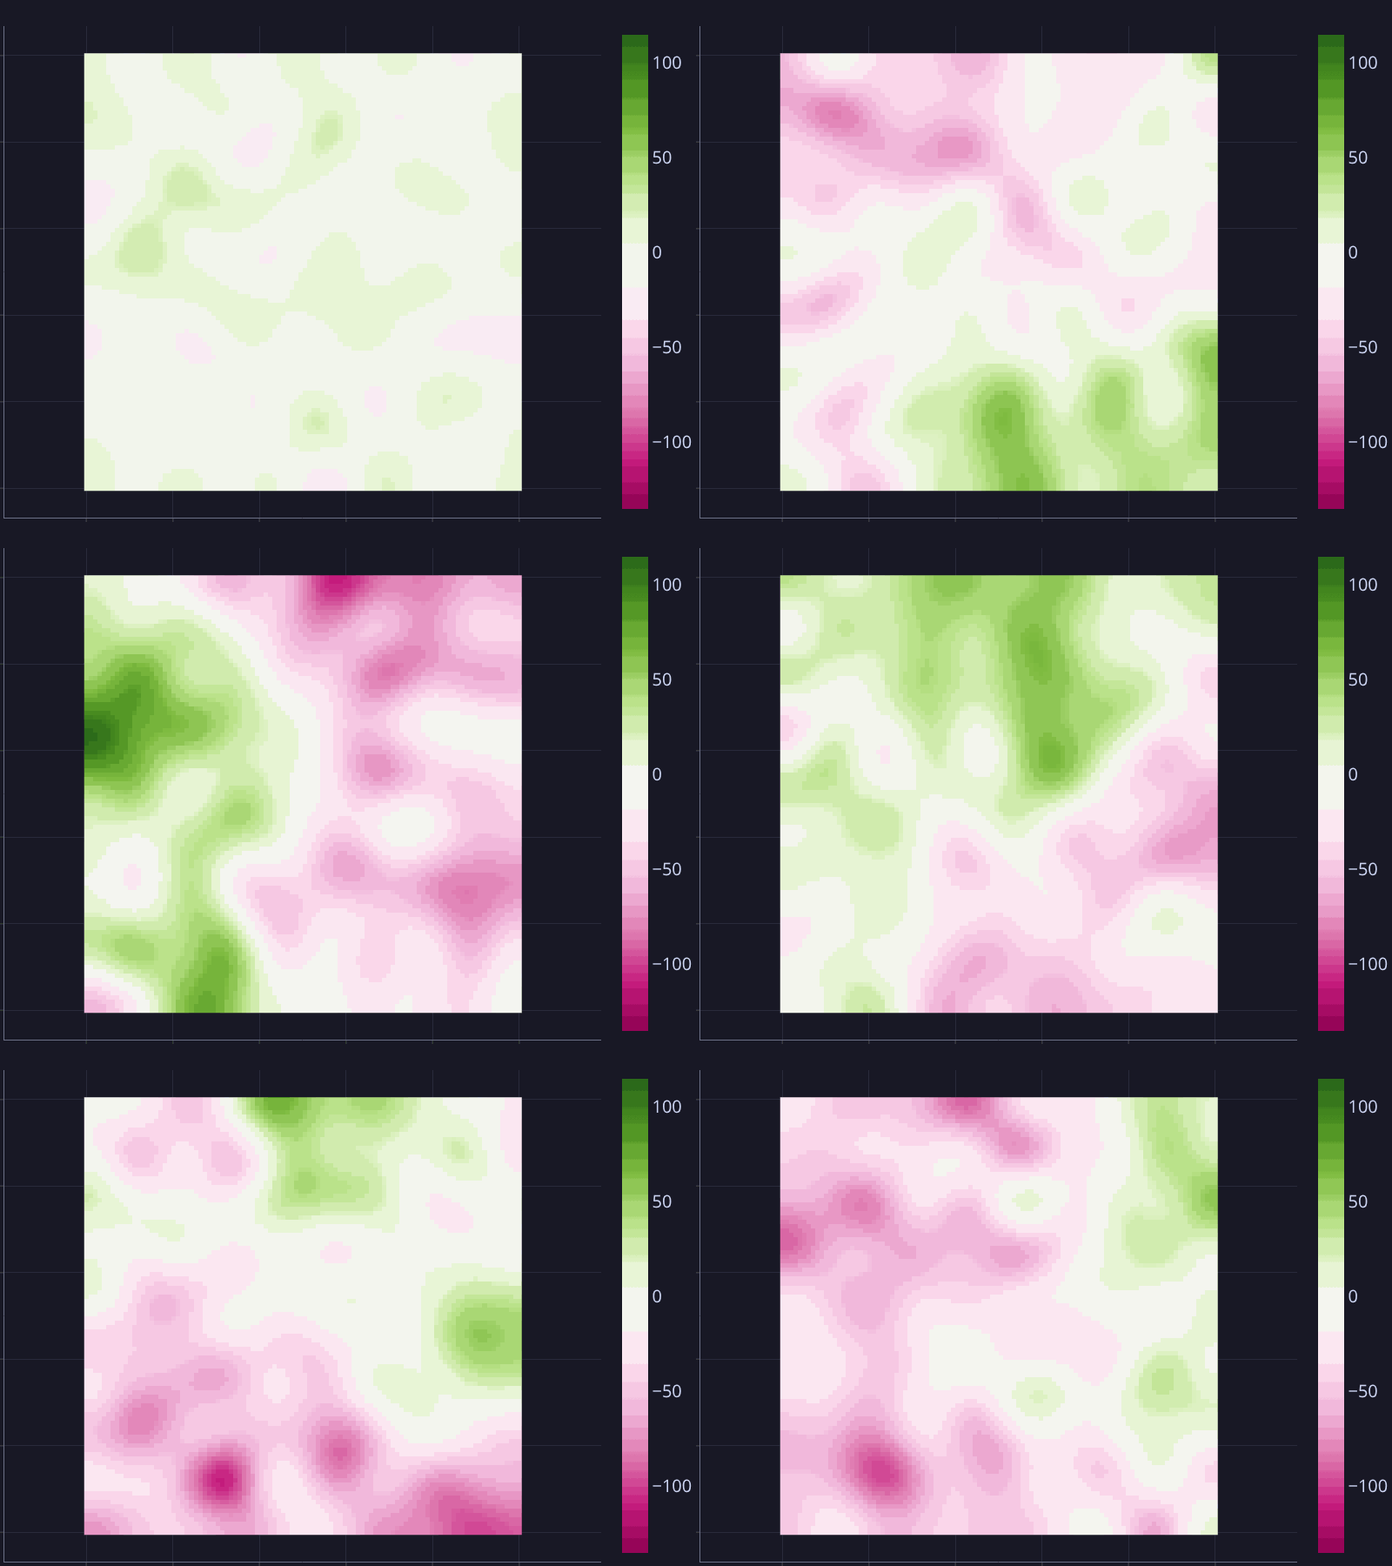
proc_frames = plotly_st_grid(process_data)
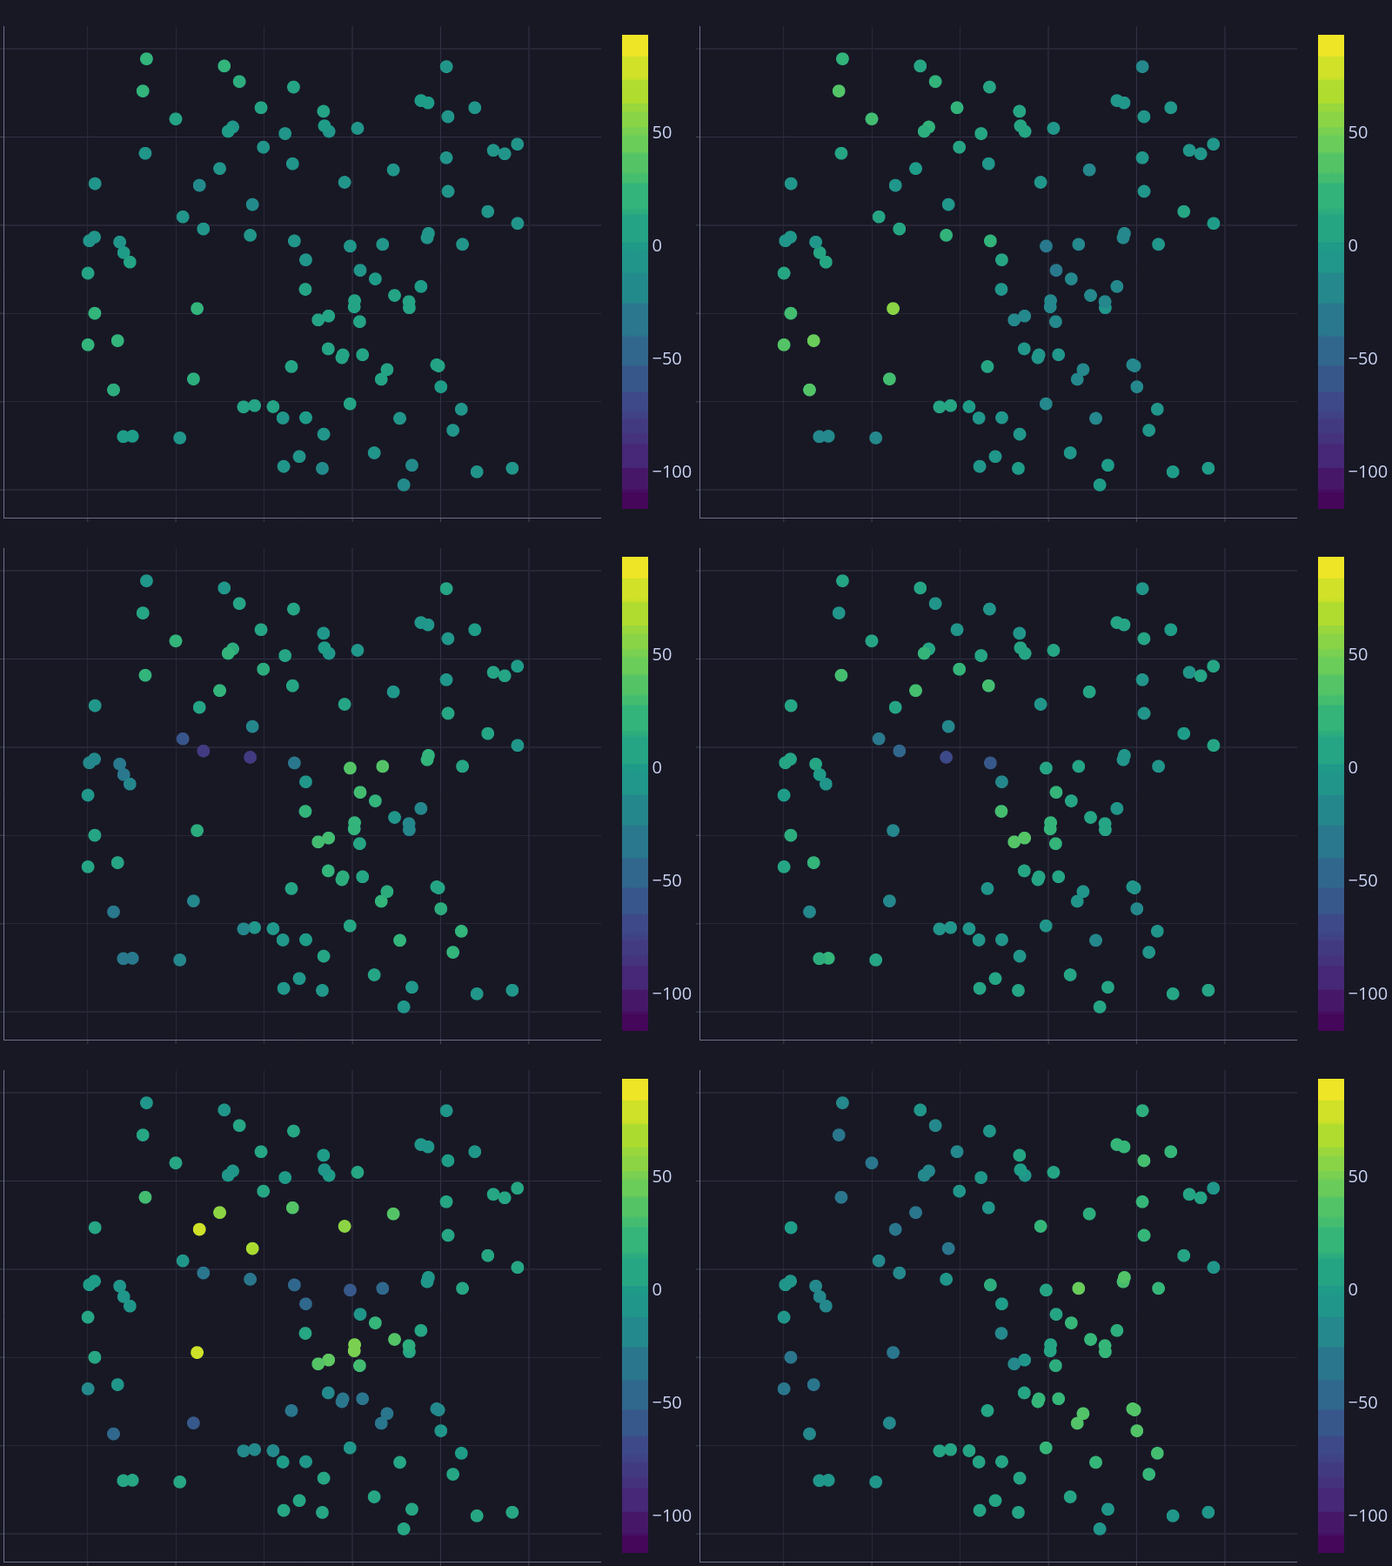
obs_frames = plotly_st_scatter(obs_data)

kernel_fig = kernel_plot(model.kernel)

apply_catppuccin_mocha(kernel_fig, fontsize=20)
kernel_fig.update_layout(
    xaxis=dict(showticklabels=False, range=[0, 1]),
    yaxis=dict(showticklabels=False, range=[0, 1], scaleanchor="x")
)

#kernel_fig.write_image("site/figure/kernel.png", format="png", scale=2)
#save_st_gif(proc_frames, "site/figure/proc2.gif", apply_theme=apply_catppuccin_mocha)
#save_st_gif(obs_frames, "site/figure/obs2.gif", apply_theme=apply_catppuccin_mocha)